Performance Monitoring Part 3 - Processor
Published on 06 Aug 2009Tags #CPU #Processor
After the introductory articles about the importance of performance monitoring and the characteristics of terminal servers in that area, I finally dive into the first and most obvious subsystem of an operating system – the processor. The processor or rather the processor cores are the workhorses of the system. They are collectively responsible for executing commands for each of the active processes. But they also switch the context between running processes to reflect the priorities assigned to each process by the operating system. In this article, I will introduce the well-known as well as some rarely used metrics to monitor the load put on the processor subsystem.
Metrics
Some metrics are very well-known and often used to benchmark a processor:
- Processor\% Processor Time
- Processor\% User Time
- Processor\% Privileged Time
These metrics can be followed as a sum of all cores (called “_Total”) or as a single value for each core. Both methods have their use cases as well as pros and cons but monitoring values for the individual cores results in a significantly larger amount of data which is harder to analyse. This is even getting worse as the number of cores is steadily increasing in desktops as well as servers. There is an important connection between the values exposed by the metrics above which can only be observed when monitoring the individual core: Processor Time = User Time + Privileged Time. This knowledge allows for the number of metrics monitored on a machine to be reduced because every one of them can be calculated from the other two values. But be sure to monitor the cores individually to be able to use this – otherwise the connection does not work due to the calculation of averages.
Visual Analyses
You have certainly experienced processes gone haywire and grabbing as much processor time as possible. As each thread (which are ultimately responsible for this behaviour) is limited to using a single core, the affected core will show 100% processor time. But the total processor time increases in characteristic steps as individual cores are fully utilized. The following graph shows the total processor time on my system as I calculate a large factorial (e.g. 99999!).
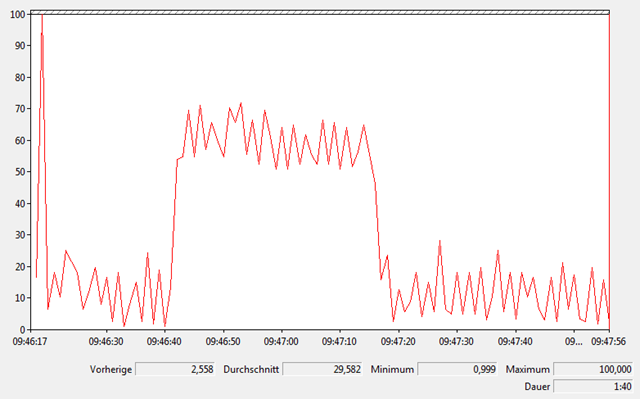
Due to the step seen in the graph, you can easily tell that my system is equipped with a dual-core processor. The baseline oscillates around 10% but as the calculator kicks in, the processor time jumps to roughly 60% which is my baseline plus 50% for the fully utilized processor.
More Metrics
In addition to the metrics mentioned above, Windows exposes several very important pieces of information for performance monitoring a system like the System\Processor Queue Length. By merely observing the processor time, it is only possible to tell when a processor is fully loaded but not whether it is overloaded and affects overall system performance. When the processor time is at 100% it may well be the case that the system is able to handle the load. But the processor queue length shows you when processes are throwing commands at the processor at a higher rate than they are executed. As a rule of thumb a single core performs ok with a queue length up to 2. This threshold applies to each core and, therefore, needs to be multiplied by the number of cores in the machine. It may also help to follow the number of processes and threads to notice a connection between the number of these objects and a situation: System\Processes and System\Threads. But there is a much more tricky metric called System\Context Switches/s. “Context” denotes a process or thread and “switch” is the process of filling registers of a processor core with the data required for another process or thread to execute on this core. Therefore, this metric tells us whether many thread are competing for processing time on the available cores. Unfortunately, there is no easy limit how many context switches a modern processor can handle as it depends on many different aspects of the operating system like the I/O subsystem. Therefore, you need to track this metric on a system which is not overloaded and establish a baseline for the system.
Detailed Analysis
If you require a detailed analyses, you can also track % Processor Time, % User Time and % Privileged Time for individual processes.
References
Mark Russinovich has written an impressing article about processes and threads as a part of his series Pushing the Limits.