Performance Monitoring Part 7 - Using Performance Monitor with a Database
Published on 02 Nov 2009Tags #Excel #Performance Monitor #Processor
After a lot of theory about performance monitoring, this article demonstrates how the Windows Performance Monitor can be used to log to a database - even from multiple machines.
Most of you have probably used Performance Monitor before. It allows you to monitor performance metrics (local and remote) in real-time and to log performance data from multiple machines for later analysis. In this article, I will focus on the latter because collecting and analysing performance data from multiple machines is a time consuming task.
For the sake of this article, I assume that your are familiar with Performance Monitor and that you know how to create a data collector set. The following example was built on Windows Server 2008. But earlier instances of Windows do not differ greatly.
How to Log to a Database
It is not very well-known that Performance Monitor is able to log the collected data to a SQL database. There are several advantages to this method:
- Several systems log to the same namespace. No more combining dozens of CSV files.
- A single database can contain several independent data sets.
- A single database can contain data from several machines.
Let me quickly outline how to log performance data to a SQL database. First, create a database on the SQL server. In my scenario, this database is called PerfMonDB. Next create a system data source pointing to your database - I called this PerfMonDSN.
After these preliminary steps, we can finally configure a new data collector set which I called PerfMonDataSet. The DataCollector01 inside PerfMonDataSet requires the following settings to successfully connect to the database. These are displayed in the two screenshots below.
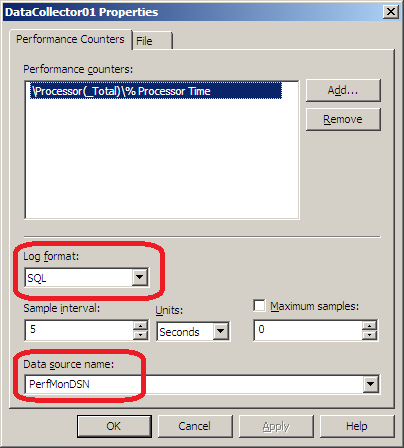
- On the tab “Performance Counters”, you need to add the required performance counters to the data collector and configure the database connection:
- The log format needs to be set to “SQL” for this scenario to work.
- The data source name is to be set to
PerfMonDSNto connect to the database configured in the preliminary steps.
- On the tab “File”, you configure the file name saved inside the database. This uniquely identifies a single run of the data collector set:
- The log file name is a custom name for the data set. I called this
PerfMonLogto distinguish this name from the others selected above. - The file name format allows some predefined variables to be appended to the log file name. This helps to identify individual runs of the same data collector set.
- By activating the check box the log file name is prefixed with the computer name executing the data collector set.
- The log file name is a custom name for the data set. I called this
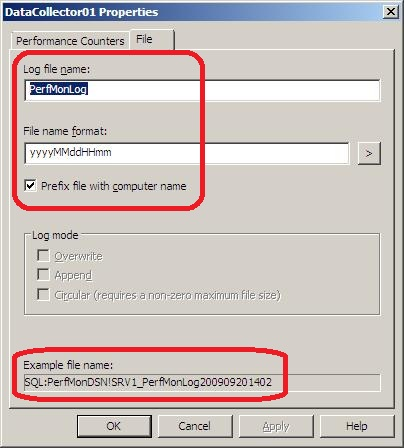
The settings above result in a unique name identifying every single run of the data collector set.
Database Schema
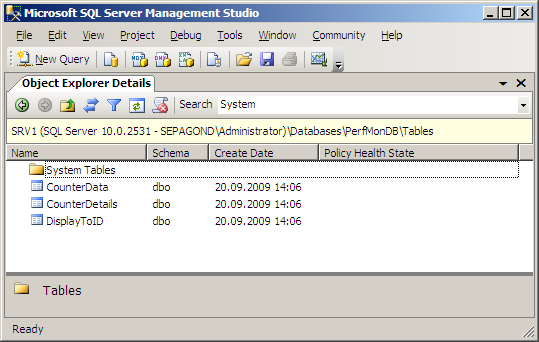
When Performance Monitor writes to a database, three tables are involved in the process: CounterData, CounterDetails and DisplayToID (see screenshot below).
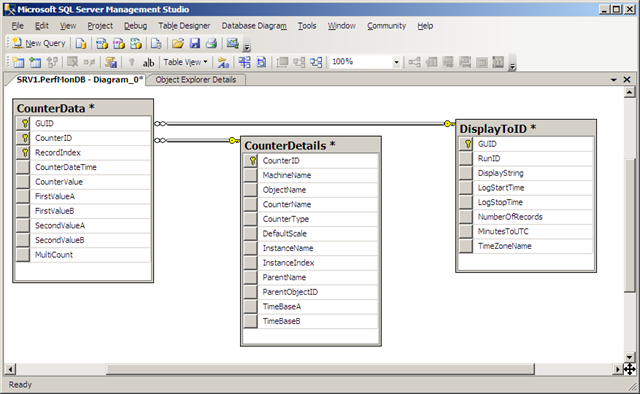
The table CounterData contains the collected data for the selected performance counters. It also references the other two tables to identify which counter and which data set the data belongs to. The screenshow below shows the relationships between the three tables.
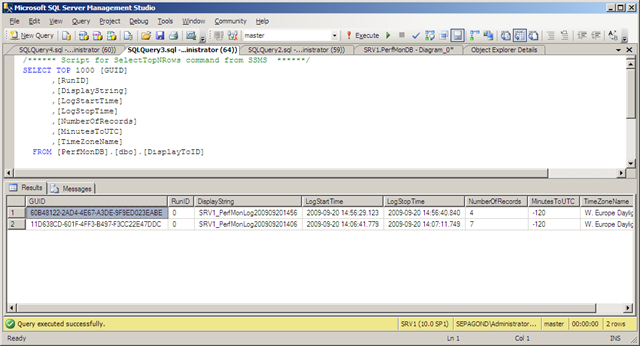
The following screenshot shows the columns of the table DisplayToID and some example data for two runs of the above data collector set. Expect a new line for every execution of every data collector. It identifies the individual runs by the following (selected) fields:
- A unique ID called
GUID- this identifier is used to refer to a certain data set from every record in CounterData - The
DisplayStringcorresponding to the example file name above - The time when the log was started and stopped (
LogStartTimeandLogStopTime)
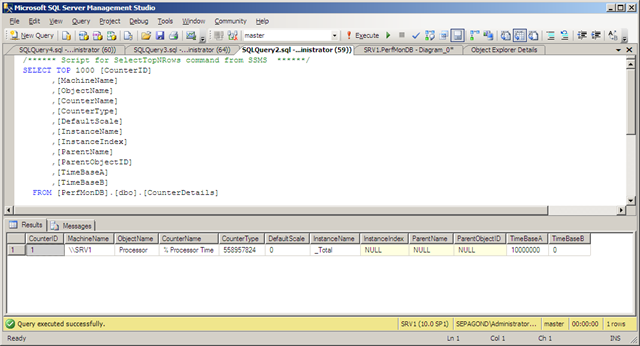
The table CounterDetails contains a description of the performance counters logged in the database. These records are independent of the data set and can be used from several data sets at once. These details contain the following information:
- A unique ID called
CounterID- this is used to refer to a certain performance counter from every record inCounterData - The
MachineNameidentifies the machine from which the performance counter is pulled - The
ObjectNameidentifies the display name of the object to which the performance counter belongs to - The
CounterNameidentifies the counter which is collected - The
InstanceNameidentifies the instance of the counter which is collected - (The other fields are not particularly interesting.)
If, for example, you have added the counter Processor(_Total)\% Processor Time this resolves to the following: ObjectName is Processor, CounterName is % Processor Time and InstanceName is _Total.
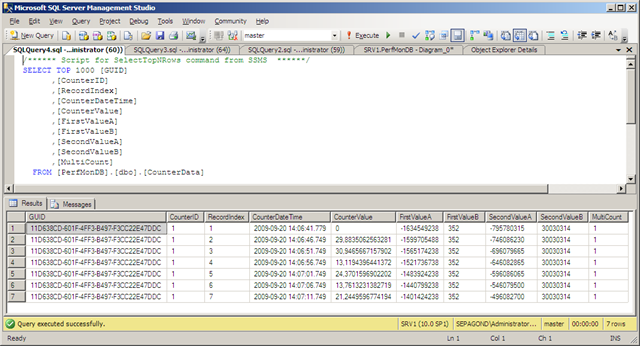
The last table called CounterData contains the data for all counters collected in individual runs of data collector sets. The following fields are relevant for an analysis:
- The GUID referencing the data set (in
DisplayToID) which the counter data belongs to - The
CounterIDreferencing the counter details (inCounterDetails) which the data belongs to - The
CounterDateTimerepresents the time stamp at which the data was collected - The
CounterValuecontains the value collected at the specified point in time
How to Analyze the Data
In the next part of this series, I will demonstrate how to use Excel to efficiently analyze the contents of the Performance Monitor database.